References:
Human-Annotated Datasets:Simonyan et al. (2013), Cao et al. (2015), Lapuschkin et al. (2016), Zhou et al. (2016), Das et al. (2017), Fong and Vedaldi (2017), Selvaraju et al. (2017), Bargal et al. (2018), Baumgartner et al. (2018), Camburu et al. (2018), Chen et al. (2018b), Chuang et al. (2018), Jha et al. (2018), Liu et al. (2018a), Park et al. (2018), Poerner et al. (2018), Wang et al. (2018a), Wu and Mooney (2018), Zhang et al. (2018a), Bastings et al. (2019), Chen et al. (2019d), Chen et al. (2019c), DeYoung et al. (2019), Fong et al. (2019), Kanehira and Harada (2019), Kanehira et al. (2019), Mitsuhara et al. (2019), Puri et al. (2019), Rajani et al. (2019), Shu et al. (2019), Sydorova et al. (2019), Taghanaki et al. (2019), Trokielewicz et al. (2019), Verma and Ganguly (2019), Wang and Nvasconcelos (2019), Wickramanayake et al. (2019), Zeng et al. (2019), Bass et al. (2020), Cheng et al. (2020), Li et al. (2020a), Liu et al. (2020), Nam et al. (2020), Pan et al. (2020a), Rio-Torto et al. (2020), Schulz et al. (2020), Subramanian et al. (2020), Sun et al. (2020), Wang and Vasconcelos (2020), Xu et al. (2020a), Xu et al. (2020b), Muhammad and Yeasin (2021), Barnett et al. (2021), Bykov et al. (2021), Jang and Lukasiewicz (2021), Joshi et al. (2021), Mathew et al. (2021), Nguyen et al. (2021), Wiegreffe and Marasović (2021), Asokan et al. (2022), Cui et al. (2022), Du et al. (2022), Mücke and Pfahler (2022), Theiner et al. (2022), Nematzadeh et al. (2023), Rasmussen et al. (2023), Ribeiro et al. (2023), Tritscher et al. (2023), Atanasova (2024), Saifullah et al. (2024)
Synthetic Datasets:Cortez and Embrechts (2013), Chen et al. (2017), Oramas et al. (2017), Ross et al. (2017), Chen et al. (2018a), Kim et al. (2018), Mascharka et al. (2018), Yang et al. (2018a), Antwarg et al. (2019), Arras et al. (2019), Camburu et al. (2019), Ismail et al. (2019), Jia et al. (2019), Lin et al. (2019), Subramanya et al. (2019), Takeishi (2019), Yang and Kim (2019), Ying et al. (2019), Amiri et al. (2020), Ismail et al. (2020), Jia et al. (2020), Kohlbrenner et al. (2020), Lucieri et al. (2020), Luo et al. (2020), Nguyen and Martínez (2020), Tritscher et al. (2020), Wang et al. (2020a), Bohle et al. (2021), Faber et al. (2021), Kim et al. (2021), Lin et al. (2021), Liu et al. (2021a), Shah et al. (2021), Yalcin et al. (2021), Agarwal et al. (2022a), Amoukou et al. (2022), Arias-Duart et al. (2022), Arras et al. (2022), Fan et al. (2022), Khakzar et al. (2022), Rao et al. (2022), Tjoa and Guan (2022), Wilming et al. (2022), Zhou et al. (2022), Agarwal et al. (2023), Hesse et al. (2023), Miró-Nicolau et al. (2023), Sun et al. (2023), Ya et al. (2023), Rao et al. (2024)
Toggle Text Reference
To evaluate the quality of explanations, many authors propose comparing them to dataset-based ground truths. This strategy can follow two distinct paradigms, depending on how the ground truth is derived. If the rationale is uniquely defined through the data generation process, we may evaluate the explanation's Fidelity. If, however, the ground truth stems from human judgment or heuristic annotation, we evaluate the Plausibility of the explanation.
The former is feasible with synthetic datasets that encode precisely one explanatory rationale. The latter is more common in practice but inherently less reliable, as black-box models may learn spurious correlations as shown by [Ribeiro et al. (2016)] or identify valid rationales beyond those provided by humans [Mücke and Pfahler (2022), Ya et al. (2023)].
Synthetic Datasets are constructed such that the relationship between input features and labels is controlled and known. Ideally, these datasets admit only a single valid rationale. Although this assumption is not always met in practice [Kim et al. (2018), Arras et al. (2019), Yang and Kim (2019), Tritscher et al. (2020), Faber et al. (2021)]. The ground-truth explanantia may either be explicitly specified, e.g., by indicating the features responsible for prediction [Chen et al. (2017), Oramas et al. (2017), Ross et al. (2017), Chen et al. (2018a), Yang et al. (2018a), Ying et al. (2019), Luo et al. (2020), Faber et al. (2021), Kim et al. (2021), Tjoa and Guan (2022), Wilming et al. (2022), Zhou et al. (2022)], or derived from the data-generation process itself, for instance using gradients or Shapley values [Cortez and Embrechts (2013), Jia et al. (2019), Jia et al. (2020), Liu et al. (2021a), Amoukou et al. (2022)]. The figure below presents selected examples.
Typical strategies for synthetic data include:
• Creating inputs from structured primitives (e.g., objects or shapes), where the target labels are deterministic functions of those primitives [Oramas et al. (2017), Ross et al. (2017), Kim et al. (2018), Yang et al. (2018a), Ying et al. (2019), Lucieri et al. (2020), Luo et al. (2020), Faber et al. (2021), Kim et al. (2021), Yalcin et al. (2021), Khakzar et al. (2022), Tjoa and Guan (2022), Agarwal et al. (2023), Hesse et al. (2023), Miró-Nicolau et al. (2023)].
• Inserting backdoor triggers into inputs, which act as the decisive explanans for altered predictions [Lin et al. (2019), Lin et al. (2021), Fan et al. (2022), Sun et al. (2023), Ya et al. (2023)].
• Performing adversarial attacks restricted to known feature subsets, which then serve as the explanatory evidence for prediction changes [Subramanya et al. (2019)].
• Generating labels as noise-free functions over randomly sampled input features, commonly in tabular domains [Cortez and Embrechts (2013), Chen et al. (2017), Chen et al. (2018a), Ismail et al. (2019), Jia et al. (2019), Amiri et al. (2020), Ismail et al. (2020), Jia et al. (2020), Nguyen and Martínez (2020), Tritscher et al. (2020), Liu et al. (2021a), Agarwal et al. (2022a), Amoukou et al. (2022)].
• Constructing mosaic images or input grids where the rationale corresponds to a localized sub-region of the input [Bohle et al. (2021), Shah et al. (2021), Arias-Duart et al. (2022), Rao et al. (2022), Rao et al. (2024)].
Advantages of synthetic datasets include reduced distribution shift when applying perturbation-based metrics (Metric “Guided Perturbation Fidelity”) [Ismail et al. (2019), Ismail et al. (2020), Hesse et al. (2023)], support for concept-level manipulations [Yang and Kim (2019), Lin et al. (2021), Hesse et al. (2023)], and the inclusion of meaningful counterfactuals or rationale variants [Yang and Kim (2019)].
Human-Annotated Datasets instead provide plausible rationales grounded in human intuition or derived from proxy labels. In some cases, annotators are explicitly asked to justify their decisions or to highlight which features they consider relevant for a particular prediction [Chen et al. (2019c), Xu et al. (2020b), Cui et al. (2022), Tritscher et al. (2023)]. In other settings, rationales are implicit, where existing annotations such as segmentation maps, bounding boxes, or other metadata are repurposed to approximate human reasoning [Selvaraju et al. (2017), Kanehira et al. (2019), Wang and Nvasconcelos (2019), Cheng et al. (2020), Saifullah et al. (2024)]. These datasets are typically used to evaluate the plausibility of explanations rather than their fidelity, as the ground-truth provided reflects human expectations rather than the actual decision-making logic of the model.
Evaluation:
Across both paradigms, the central assumption is that accurate model predictions imply alignment with the intended rationale, thereby justifying a comparison between the generated explanantia and the ground-truth annotations. This comparison can be performed using any suitable similarity metric (see Similarity Measures). While FA evaluations often rely on feature-level scoring, CEs and NLEs require domain-appropriate measures.
In the context of FAs, several dedicated evaluation strategies were reported. Precision and recall can be computed over truly important features to assess how well the explanation captures relevant inputs [Bastings et al. (2019)]. Other techniques evaluate the ranking of important and unimportant features [Chen et al. (2017), Chen et al. (2018a), Antwarg et al. (2019), Camburu et al. (2019)], or quantify the symmetric difference between the sets of selected and annotated features [Nguyen and Martínez (2020)]. A particularly common metric involves summing the attribution values over known important features, often with normalization or weighting adjustments [Lapuschkin et al. (2016), Yang and Kim (2019), Kohlbrenner et al. (2020), Nam et al. (2020), Rio-Torto et al. (2020), Wang et al. (2020a), Xu et al. (2020a), Bohle et al. (2021), Kim et al. (2021), Arias-Duart et al. (2022), Arras et al. (2022), Zhou et al. (2022)].
For visual and natural language domains, the well-known Pointing Game checks whether the most highly attributed features lie within predefined ground-truth regions such as bounding boxes or key tokens [Bargal et al. (2018), Poerner et al. (2018), Zhang et al. (2018a), Fong et al. (2019), Sydorova et al. (2019), Taghanaki et al. (2019), Takeishi (2019), Schulz et al. (2020), Barnett et al. (2021), Arras et al. (2022), Theiner et al. (2022)]. Closely related is Weakly Supervised Localization, where the explanans is compared directly to segmentation masks or bounding boxes, typically using Intersection-over-Union (IoU) [Simonyan et al. (2013), Cao et al. (2015), Zhou et al. (2016), Fong and Vedaldi (2017), Selvaraju et al. (2017), Wickramanayake et al. (2019), Muhammad and Yeasin (2021), Nguyen et al. (2021), Fan et al. (2022)]. In multi-label or multi-object scenarios, further alignment can be tested by verifying whether the explanation focuses on the input features associated with the predicted label [Du et al. (2019)].
For CEs, evaluation typically involves test datasets that explicitly annotate the presence or absence of each concept, enabling precise assessment of concept identification accuracy [Kim et al. (2018), Lucieri et al. (2020), Asokan et al. (2022)].
For NLEs, comparisons to reference justifications rely on general natural language processing measures such as BLEU or ROUGE [Camburu et al. (2018), Chuang et al. (2018), Liu et al. (2018a), Wu and Mooney (2018), Chen et al. (2019d), Rajani et al. (2019), Wickramanayake et al. (2019), Li et al. (2020a), Sun et al. (2020), Jang and Lukasiewicz (2021), Wiegreffe and Marasović (2021), Ribeiro et al. (2023), Atanasova (2024)], as well as similarity measures specifically designed for NLEs [Park et al. (2018), Du et al. (2022)]
Finally, to ensure that the evaluation isolates explanation quality from predictive accuracy, [Fan et al. (2022)] recommend to limit evaluation to those samples for which the model's prediction is both correct and sufficiently confident.
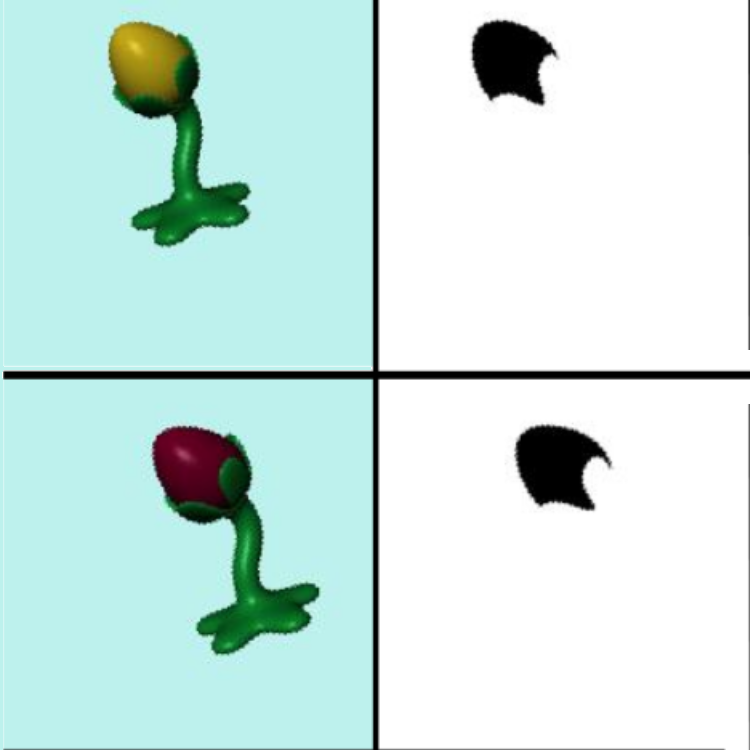
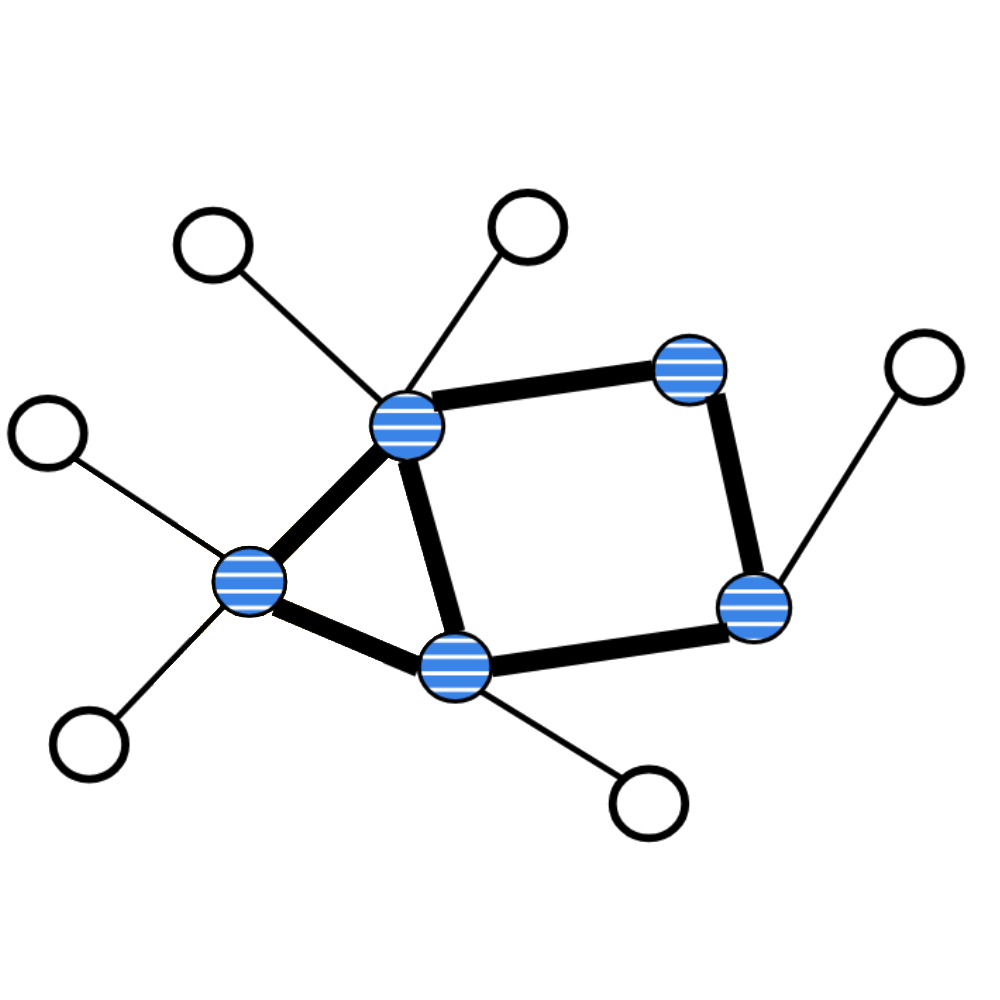

Examples of synthetic datasets containing ground-truth explanantia of relevant features. Left: The an8Flower dataset [Oramas et al. (2017)], Center: The ShapeGGen dataset [Agarwal et al. (2023)], Right: The SCDB dataset [Lucieri et al. (2020)].